Evaluation of Tillage Systems as Related to Peanut Yield

Effect of Tillage on Yield of Peanut in Mississippi
Introduction:
Tillage operations vary greatly in peanut production across the state of Mississippi. Generally, there is more use of conservation tillage in the southern areas, and more conventional tillage in the northern areas. Most of the conservation tillage involves some type of strip tillage operation, while conventional tillage usually includes at least one disking followed by a field cultivator or do-all to break up clods, and in some cases, raised beds are utilized. This study was designed to evaluate the effects of different tillage systems as they relate to peanut yield.
Methods:
This study was conducted in two locations in Mississippi. The first was near Lucedale and was on a soil composed of 66% Lucedale sandy loam and 34% McLaurin fine sandy loam. The second location was near Hamilton and was on a soil composed of Cahaba fine sandy loam. In both locations, there were four tillage systems utilized: 1. Disk followed by field cultivator, 2. Orthman 1tRIPr equipped with rubber press wheels, 3. Orthaman 1tRIPr equipped with a tumbling basket, and 4. Disk followed by a turning plow, followed by a field cultivator. Plots were 50 feet long by 4 rows wide, and were arranged in a randomized complete block design with four replications. At the Lucedale location, tillage operations were performed on May 10 and planted on May 11. In Hamilton, tillage operations were performed on May 13, and planted on May 25. Yield was determined by mechanically harvesting the center two rows of each plot with a Hobbs 2 row peanut combine equipped with a bagging attachment.
Results:
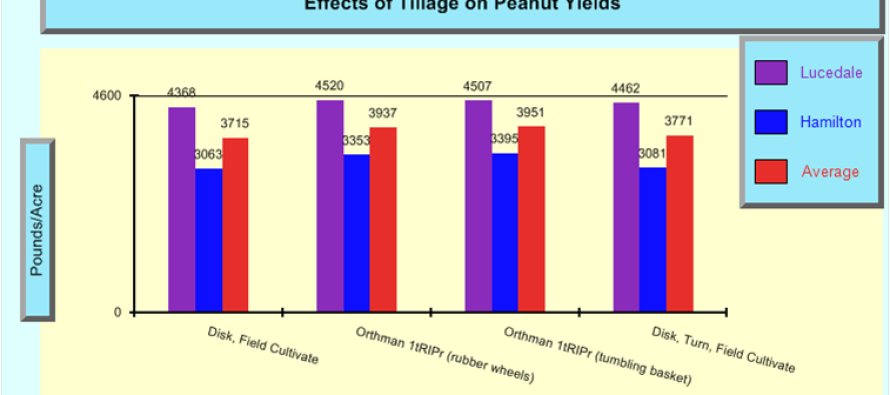
There were no differences between treatments at the Lucedale location. Yields ranged from 4368 pounds per acre to 4520 pounds per acre. In the Hamilton location, both treatments utilizing the Orthman 1tRIPr yielded significantly higher than the conventional systems. Yields ranged from 3063 to 3395. When data from both locations were averaged together, once again there was a significant yield advantage for both systems with the Orthman 1tRIPr compared to the conventional treatments (Table 1, Figure 1).
Discussion:
In the first year of this study, there was a statistical advantage for the Orthman 1tRIPr at one of the two locations. This location, Hamilton, MS, received little rainfall during the growing season, especially in the last 6 weeks of production. On the other hand, the Lucedale location received adequate rainfall during most of the growing season, and turned dry near harvest time. The difference in rainfall could be one possible reason for the advantages seen in the Hamilton location. The deep tillage in the seed furrow may have allowed more water to be held when rainfall occurred than in the conventional tilled plots. Another possible factor was also related to weather. In the Hamilton location, soil moisture was so low at harvest time that diggers had trouble penetrating the soil. Large clods were attached to peanuts in many cases which no doubt reduced yield. It is possible that by using the Orthman 1tRIPr, the soil was less compacted at harvest time, allowing for more efficient digging.
This study is planned to be continued again in 2011. Plans are to take measurements on soil moisture and soil compaction on a weekly basis throughout the growing season. Also, the addition of a no-till treatment will be added.
Table 1. Effect of Tillage on Yield of Peanuts
| Trt | Treatment | ||||||||
| No. | Name | Lucedale | Hamilton | Average | |||||
| 1 | Disk, Field Cultivate | 4368 | a | 3063 | b | 3715 | b | ||
| 2 | Orthman 1tRIPr (rubber wheels) | 4520 | a | 3353 | a | 3937 | a | ||
| 3 | Orthman 1TRIPr (tumbling basket) | 4507 | a | 3395 | a | 3951 | a | ||
| 4 | Disk, Turn, Field Cultivate | 4462 | a | 3081 | b | 3771 | b | ||
| LSD (P=.05) | 165.2 | 175.4 | 85.3 | ||||||
| Standard Deviation | 103.3 | 109.6 | 53.3 | ||||||
| CV | 2.31 | 3.4 | 1.39 | ||||||
| Grand Mean | 4464.19 | 3223.0 | 3843.59 | ||||||
| Bartlett’s X2 | 0.775 | 3.091 | 0.843 | ||||||
| P(Bartlett’s X2) | 0.856 | 0.378 | 0.839 | ||||||
| Friedman’s X2 | 5.1 | 9.9 | 10.875 | ||||||
| P(Friedman’s X2) | 0.165 | 0.019 | 0.012 | ||||||
Means followed by same letter do not significantly differ (P=.05, Student-Newman-Keuls)
Mean comparisons performed only when AOV Treatment P(F) is significant at mean comparison OSL.
Figure 1. Effects of Tillage on Yield of Peanuts


Let me tell You a sad story ! There are no comments yet, but You can be first one to comment this article.
Write a comment